There has on occasion been reference to the 2007 Launceston City Council Open Space Strategy about the lack of open green space in East Launceston. The full report is available from below:
http://www.stors.tas.gov.au/au-7-0095-02890_1
The report warrants some further analysis of the facts. The report notes that:
"Each suburb/locality was assessed for its current open space provision. The number of parks and the area of parks compared to the population of each suburb/locality was assessed." page 4.
and;
"This plan deals primarily with open space owned and managed by the Launceston City Council." page 7.
The report does not show the proportion of open space to the total area of the locality. East Launceston is a relatively densely populated suburb, being an inner city suburb of Launceston, but has a small footprint for the population size. A further analysis of the proportion of open space to the total area of the localities is warranted.
An image of the table for East Launceston on page 27 of the report is shown below:
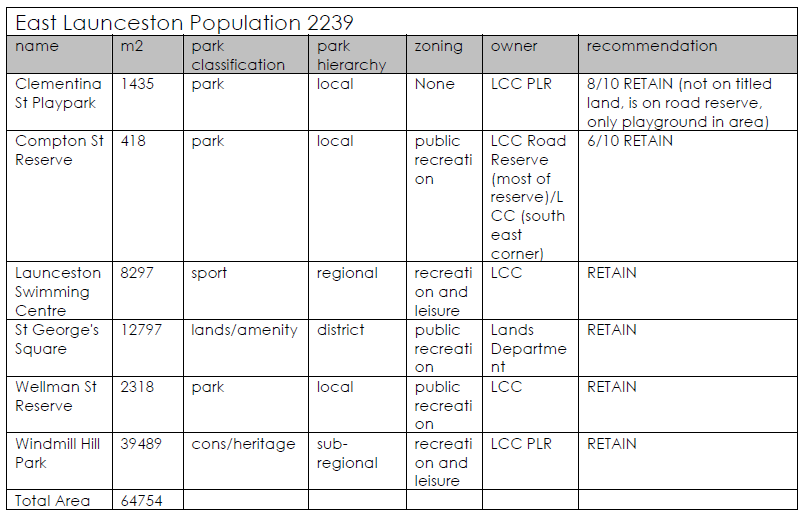
The above chart makes no mention of the East Launceston Oval in calculating the amount of open green space in the suburb. This is because whilst the space is available to the public, it is not public space, but privately owned by the P&F and DoE.
The East Launceston Oval site is over 24,000m2. If this is added to the total above, there is over 88,000m2 or 8.8ha (a 37% increase) of open green space in East Launceston. The East Launceston Oval makes up 27% of the open space in East Launceston. This is a significant anomoly in the report.
The geographic area that is defined in the report for East Launceston is significantly smaller than other suburbs listed (97ha according to theList). Including the oval with open space makes up 9% of the total area.
If you compare the neighbouring localities percentage of open space to the total area:
| Locality | Total Area (ha) | Open Space Area (ha) | % Open Space of Total Area (%) |
| East Launceston | 97 | 8.8 * | 9 |
| Launceston | 455 | 41 | 9 |
| Newstead | 392 | 39 | 10 |
| Norwood | 367 | 13 | 3 |
| Punchbowl | 58 | 25 | 43 |
| Kings Meadows | 499 | 69 | 13 |
| South Launceston | 280 | 18 | 6 |
| West Launceston | 390 | 96 | 24 |
* Including the East Launceston Oval.
Total area was found using theList (http://www.thelist.tas.gov.au). TheList allows you to search for localities and find the total area of each locality. The area of open space can be found in the strategy report. The figures have been converted to hectares for readability.
What the above figures show, is that if the East Launceston Oval is included in the open space, then on a per area basis, East Launceston has proportionally as much open green space as the Launceston and Newstead localities, and significantly more than Norwood and South Launceston. Punchbowl and West Launceston contain large reserves which skews the figures higher for those localities.
The argument that East Launceston has less green space than most other localities is true, but it is also only a third of the size of most of its neighbouring localities. Proportionally, East Launceston is on par with its surrounding suburbs, and is higher than some.
What does this have to do with the Land Swap? The East Launceston Oval will always be co-owned by the P&F and the DoE. This is not changing. What is changing is the footprint that each party holds. The size of the land holdings is not changing. There is no proposal to further build on the site. The above information is provided only to provide the facts for our members. It’s easy to make sweeping statements and quote reports, but it’s harder to look beyond the statements and look at the data and the facts.
The P&F are committed to providing open space for the use by the public. The P&F will be working to enhance the site and provide more recreational activities for the public on the site. The P&F is fully supportive of the benefits of open green space to the community and of the principles of the strategy.